18XT Vehicle dynamics
I was the Suspension Lead Engineer for the 18XT, the Johns Hopkins University's first top-10 car in the past five years. Over its three competitions, the car won the following awards while competing against more than 100 teams (some international!):
TENNESSEE 2022:
Design - 1st Place
Static Events - 3rd Place
ROCHESTER 2022:
Design - 2nd Place
Static Events - 4th Place
ARIZONA 2023 (as Team Captain):
Design - 2nd Place
Overall - 8th Place
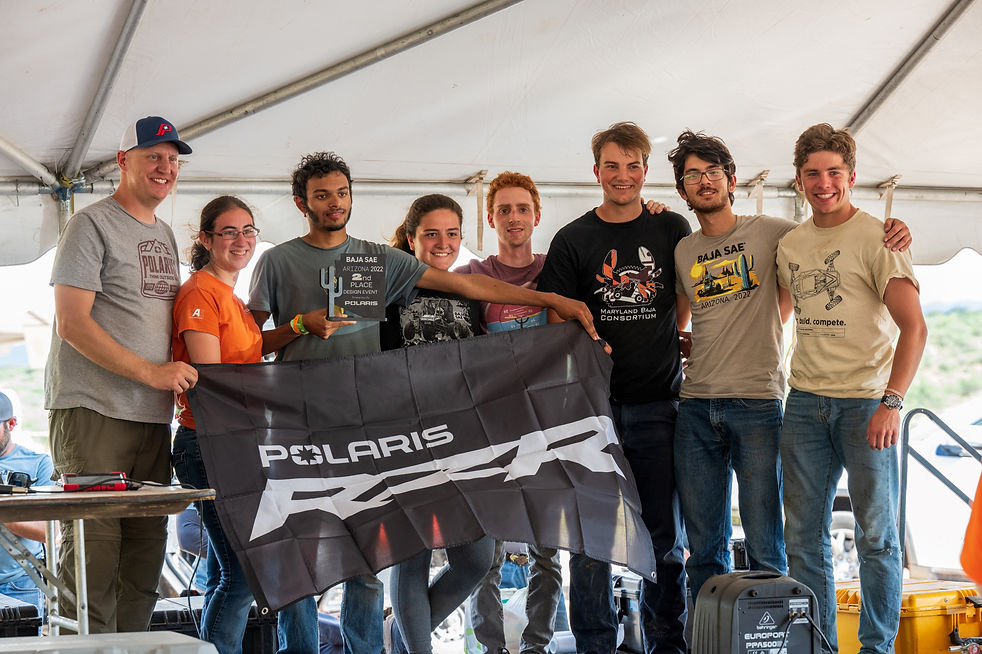.jpeg)
Above: 2nd Place Design Event at Arizona 2023
Below: Suspension, Steering, Brakes Design Poster
OVERVIEW

This part of the 18XT is the most invisible level of design, as all of the parameters do not actually change how the car looks. However, they are critically important for the vehicle's handling characteristics.
The challenge I was faced with is that spring, ride, roll, and damping rates had not been actively used in design in previous years. As such, there was no knowledge base to stand on, especially considering that changes could significantly impact vehicle handling.
From a high level, I took the qualities of a previous car that handled well, back-calculated the parameters that caused it to be successful as well as improving in other areas, and then recalculated the corresponding ideal ones for the 18XT.
SPREADSHEET CALCULATIONS
RIDE RATES
Ride rates are the "spring constant" of a suspension corner when a vertical load is applied at the contact patch of the tire. The following factors impact them:
-
Spring stiffness (also called spring rate)
-
Distance between spring mount and center of wheel (also called an installation ratio)
-
Tire stiffness
-
Component compliances
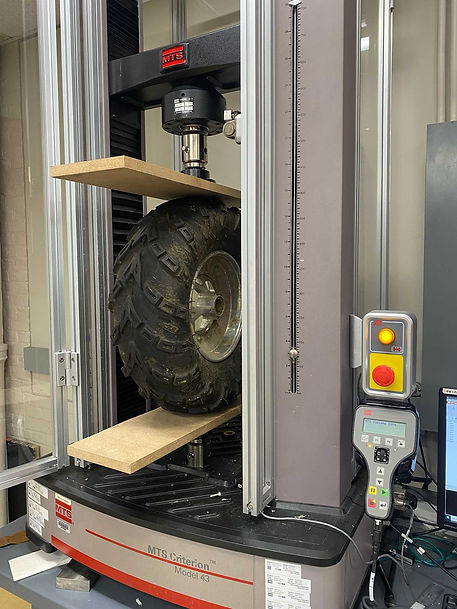
For simplicity, I initially assumed infinite tire and component stiffness. However, following vertical tire stiffness testing, I added this into the calculation as well.
Ride rates affect how the suspension absorbs undulations, as well as sudden shock loads, and should be sized such that "bottoming out" does not occur for maximum component durability.
Essentially this boils down to choosing spring rates, as the installation ratios were predetermined by already designed suspension geometry.
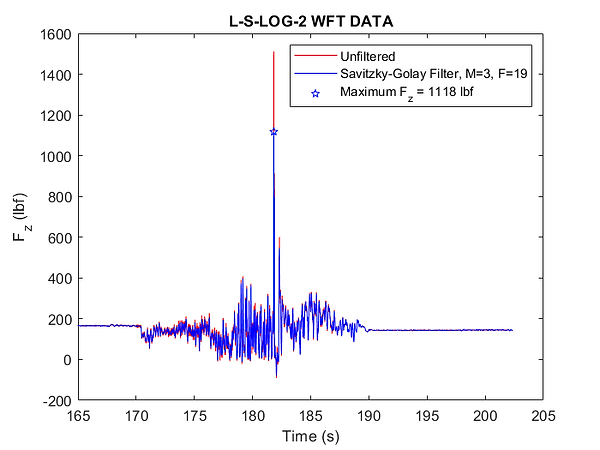
To accomplish this, first I used data from a dynamic test that was run in the summer. However, the raw data was incredibly noisy, so I filtered it until reasonable consistency in the data was achieved. The result from this was still higher than the values from assumptions, meaning that our previous ride rates were too low.
Then, I first used damping plots from a shock tuning manual and and our maximum recorded shock travel rate to get our maximum theoretical damping force.
Then, the ride rates could be back-calculated, eventually arriving at the proper spring rates.
ROLL RATES
Roll rates are the "spring constant" across a vehicle's axle that oppose the natural rolling motion of the car through a corner. The following factors impact them:
-
Ride rates
-
Anti-roll bars (and their corresponding installation ratios)
-
Frame torsional compliance
Again, for simplicity I assumed frame torsional rigidity was negligible (infinitely stiff chassis).
As the ride rates have already been chosen, the "natural" roll rates of each axle are already determined. Only the anti-roll bar stiffness will impact the vehicle's handling. However, I chose the ride rates such that an anti-roll bar was no longer necessary, while still retaining the same front-to-rear roll stiffness ratio as last year's car.
DAMPING
The last major part of dynamic suspension calculations is choosing damping ratios. Generally, it is ideal to be around 1/3 of the critical damping number (taken from the car weight and corresponding ride rates).
However, for different vehicle applications, the damping ratio changes significantly. For Baja offroad racing, high compression damping is desired due to the harsh obstacles, while relatively low rebound damping is necessary to maintain contact with the ground as much as possible.
I also used shock force - velocity plots to determine the contribution of the shock absorber to maximum deceleration impacts, and ended up at a ~2G allowable, which is similar to that measured on-car during a previous test day.
.png)
COMPETITION PERFORMANCE
Overall, there was a lack of full-scale handling tests that were similar to competition. As a result, the suspension tuning was not ideal as the following handling flaws were discovered:
-
Overly stiff suspension led to vehicle pitching and required a good driver to prevent rollovers;
-
Lack of Ackermann led to poor cornering performance.
-
"Tricycling" handling philosophy was not useful for steady-state cornering.
The handling flaws are apparent in the following video from Arizona 2022, with a "lazy front-end" to the car that required oversteering the rear. On gripper surfaces such as clay, the inability to forcibly oversteer the rear led to a large turning radius and poor handling characteristics.
The experience I gained from this helped me form my design vision for the next car, the 19XT, where I would be designing the kinematic hardpoints and had a say in the ride and roll rates.